Array
(
    [id] => 116
    [title] => Weapons Used in Domestic Violence in Los Angeles in 2020
    [settings] => Array
        (
            [id] => 116
            [align] => center
            [margin] => 10,10,10,170
            [width] =>
            [height] => 1000
            [font_size] =>
            [transition] =>
            [delay] =>
        )

    [description] =>
    [src] => Array
        (
            [multiple] => 0
            [type] => file
            [key] =>
            [multiple_key] =>
            [data] => http://statisticsandstereotypes.com/wp-content/uploads/2020/05/WEAPONSUSED-dv-la2.csv
        )

    [type] => bar
    [key] => Array
        (
            [0] => Weapon
            [1] => Total
            [color] => Weapon
        )

    [reverse] => Array
        (
            [0] => 1
            [1] => 0
            [color] => 0
            [area] =>
            [multiple] =>
        )

    [format] => Array
        (
            [0] => Array
                (
                    [prepend] =>
                    [append] =>
                    [divider] =>
                    [parameter] =>
                )

            [1] => Array
                (
                    [prepend] =>
                    [append] =>
                    [divider] =>
                    [parameter] =>
                )

            [color] => Array
                (
                    [prepend] =>
                    [append] =>
                    [parameter] =>
                )

        )

    [x] => Array
        (
            [data] => 1
            [align] => bottom
            [ticks] => 0
            [min] => 0
            [max] => 30
        )

    [y] => Array
        (
            [data] => 0
            [align] => left
            [ticks] => 1
            [label] =>
            [grid] =>
            [grid_increment] =>
        )

    [bar] => Array
        (
            [gutter] => 0.8
            [text_within] => 0
        )

    [color] => Array
        (
            [background] =>
            [palette] => Array
                (
                    [0] => #e25134
                )

            [by] =>
            [legend] => 0
        )

    [text] => Array
        (
            [name_size] => 1
            [value_size] =>
            [ticks_size] =>
            [legend_size] =>
        )

    [tooltip] => Array
        (
            [enable] => 1
            [text_align] => right
            [width] =>
            [direction] => n
            [direction_parameter] =>
            [content] =>
        )

    [front] => Array
        (
            [instance] => 1
            [wrapper_id] => data-visualizer-116
        )

)
Is more domestic violence happening in Los Angeles while people are being quarantined? You might be surprised at what the data shows.
Many experts around the world expect there to be more cases of domestic violence during the quarantine lockdown, as more people are forced to spend more time together since people are not going to work or out in public due to the lockdown. Are the numbers saying that is the case?
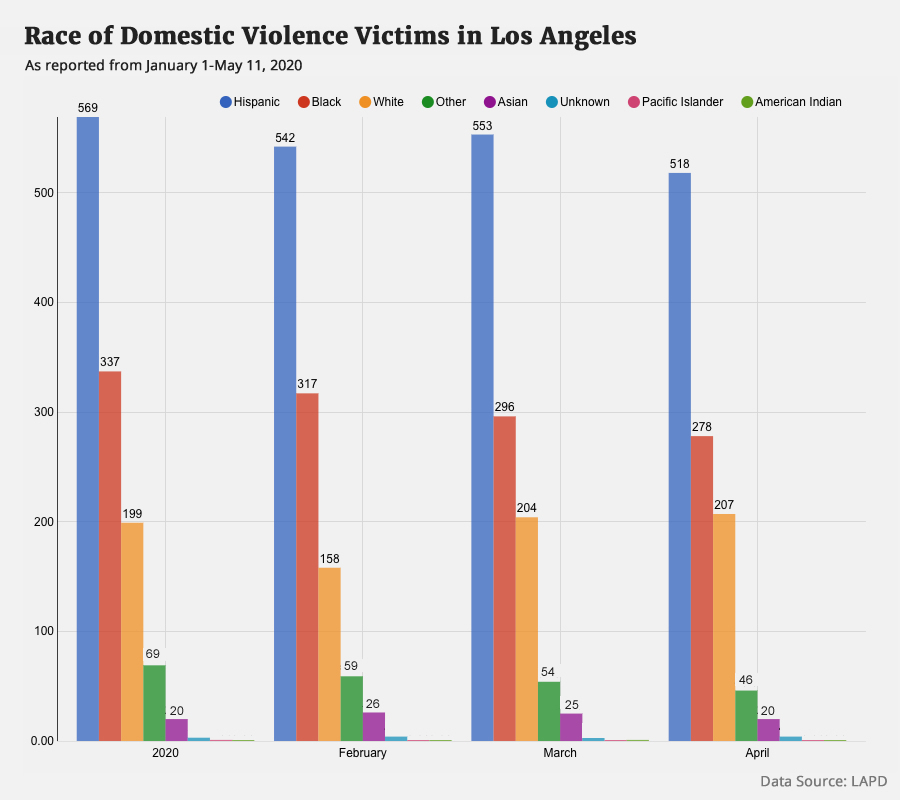
The map below shows all the reported cases of domestic violence and the locations of each incident. The different colors represent the races of the victims of domestic violence. This map is also interactive so you can hover over any dot to find details of the abuse, including:
- Race of the victim
- Sex of the victim
- Age of the victim
- Date of incident
- Time of incident
- Name of area
- Weapon used
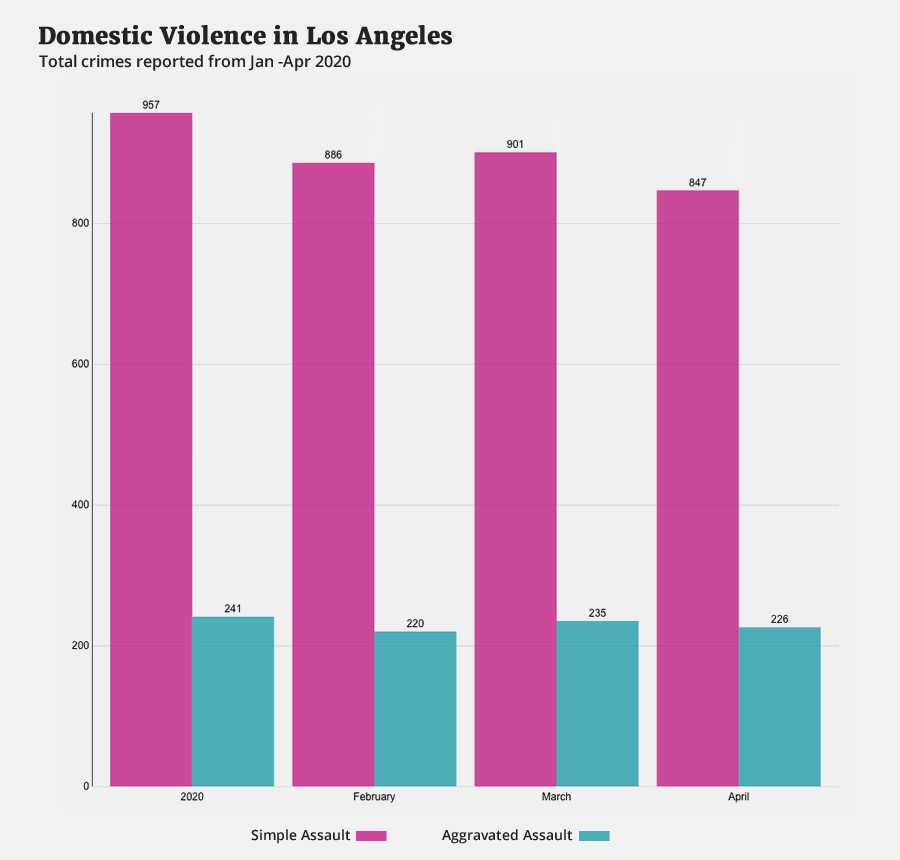
It is surprising to see that the numbers of reported cases have actually gone down overall. Why is this the case?
Can this be explained by the fact that victims are not able to escape their abusers during the time when they are locked down, so reporting is down? Yes.
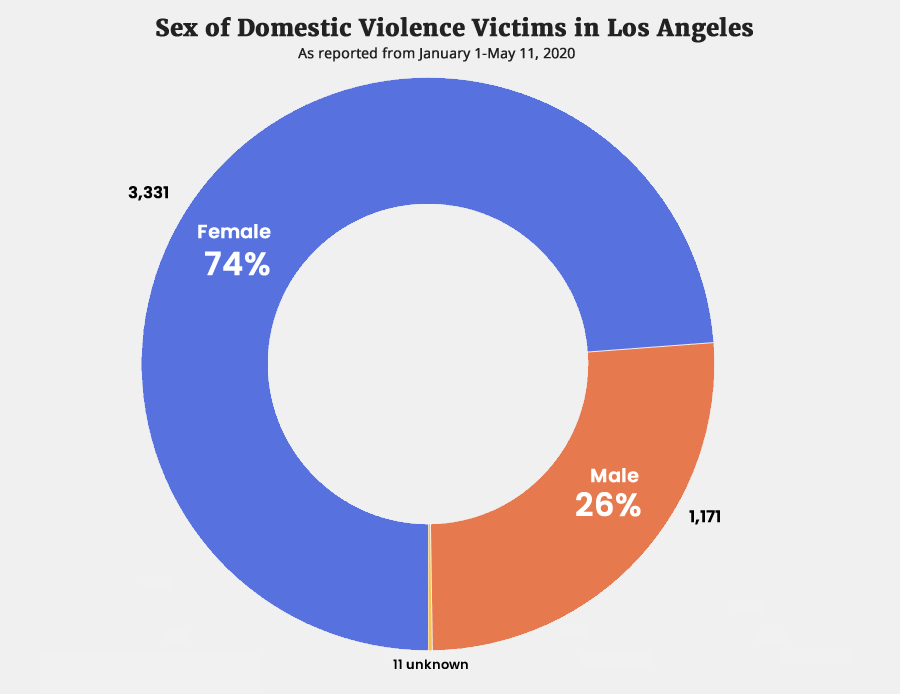
FYI, it’s not just females that are the victims of domestic violence. More than 1/4 of all victims are males.
Weapons Used
In over 87% of all cases involving domestic violence, the reported weapon used is hands, fist , feet or bodily force. But 13% of the time other weapons are used.
Here we can also see the weapon used as reported to LAPD. Take a look at some of the weapons used. While hands, fist, feet or bodily force is obviously the most used, take a look at some of these others.
| Weapon Used | Count |
| STRONG-ARM (HANDS, FIST, FEET OR BODILY FORCE) | 3947 |
| UNKNOWN WEAPON/OTHER WEAPON | 211 |
| BOTTLE | 27 |
| KNIFE WITH BLADE 6INCHES OR LESS | 27 |
| OTHER KNIFE | 25 |
| VEHICLE | 25 |
| BLUNT INSTRUMENT | 24 |
| HAND GUN | 21 |
| STICK | 21 |
| VERBAL THREAT | 19 |
| KITCHEN KNIFE | 13 |
| CLUB/BAT | 12 |
| FOLDING KNIFE | 11 |
| MACE/PEPPER SPRAY | 11 |
| ROCK/THROWN OBJECT | 11 |
| BELT FLAILING INSTRUMENT/CHAIN | 10 |
| KNIFE WITH BLADE OVER 6 INCHES IN LENGTH | 10 |
| PIPE/METAL PIPE | 10 |
| UNKNOWN | 9 |
| SEMI-AUTOMATIC PISTOL | 9 |
| SCISSORS | 8 |
| HAMMER | 7 |
| FIXED OBJECT | 6 |
| SCREWDRIVER | 4 |
| AIR PISTOL/REVOLVER/RIFLE/BB GUN | 3 |
| GLASS | 3 |
| MACHETE | 3 |
| REVOLVER | 3 |
| SCALDING LIQUID | 3 |
| STUN GUN | 3 |
| CONCRETE BLOCK/BRICK | 2 |
| LIQUOR/DRUGS | 2 |
| OTHER CUTTING INSTRUMENT | 2 |
| RAZOR BLADE | 2 |
| SHOTGUN | 2 |
| UNKNOWN FIREARM | 2 |
| BRASS KNUCKLES | 1 |
| HECKLER & KOCH 93 SEMIAUTOMATIC ASSAULT RIFLE | 1 |
| RAZOR | 1 |
| RIFLE | 1 |
| SWITCH BLADE | 1 |
If you or someone you know is experiencing domestic violence, contact the National Domestic Violence Hotline by calling 1-800-799-SAFE (7233), visiting www.thehotline.org or texting LOVEIS to 22522.


