Domestic Violence in Los Angeles During Covid-19

Array
(
    [id] => 116
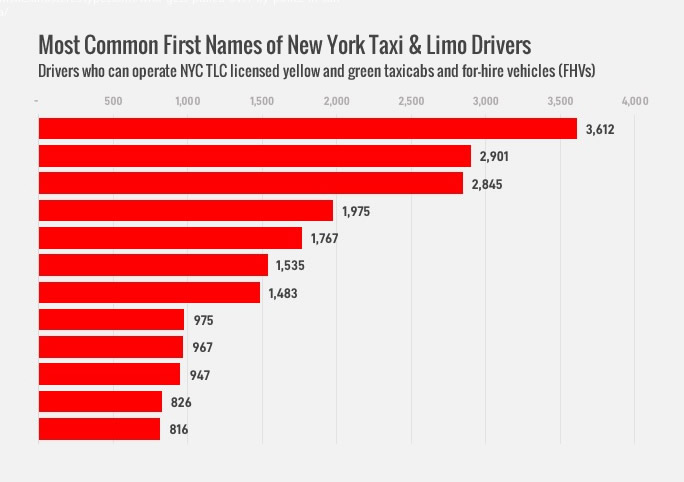
    [title] => Weapons Used in Domestic Violence in Los Angeles in 2020
    [settings] => Array
        (
            [id] => 116
            [align] => center
            [margin] => 10,10,10,170
            [width] => 
            [height] => 1000
            [font_size] => 
            [transition] => 
            [delay] => 
        )

    [description] => 
    [src] => Array
        (
            [multiple] => 0
            [type] => file
            [key] => 
            [multiple_key] => 
            [data] => http://statisticsandstereotypes.com/wp-content/uploads/2020/05/WEAPONSUSED-dv-la2.csv
        )

    [type] => bar
    [key] => Array
        (
            [0] => Weapon
            [1] => Total
            [color] => Weapon
        )

    [reverse] => Array
        (
            [0] => 1
            [1] => 0
            [color] => 0
            [area] => 
            [multiple] => 
        )

    [format] => Array
        (
            [0] => Array
                (
                    [prepend] => 
                    [append] => 
                    [divider] => 
                    [parameter] => 
                )

            [1] => Array
                (
                    [prepend] => 
                    [append] => 
                    [divider] => 
                    [parameter] => 
                )

            [color] => Array
                (
                    [prepend] => 
                    [append] => 
                    [parameter] => 
                )

        )

    [x] => Array
        (
            [data] => 1
            [align] => bottom
            [ticks] => 0
            [min] => 0
            [max] => 30
        )

    [y] => Array
        (
            [data] => 0
            [align] => left
            [ticks] => 1
            [label] => 
            [grid] => 
            [grid_increment] => 
        )

    [bar] => Array
        (
            [gutter] => 0.8
            [text_within] => 0
        )

    [color] => Array
        (
            [background] => 
            [palette] => Array
                (
                    [0] => #e25134
                )

            [by] => 
            [legend] => 0
        )

    [text] => Array
        (
            [name_size] => 1
            [value_size] => 
            [ticks_size] => 
            [legend_size] => 
        )

    [tooltip] => Array
        (
            [enable] => 1
            [text_align] => right
            [width] => 
            [direction] => n
            [direction_parameter] => 
            [content] => 
        )

    [front] => Array
        (
            [instance] => 1
            [wrapper_id] => data-visualizer-116
        )

)

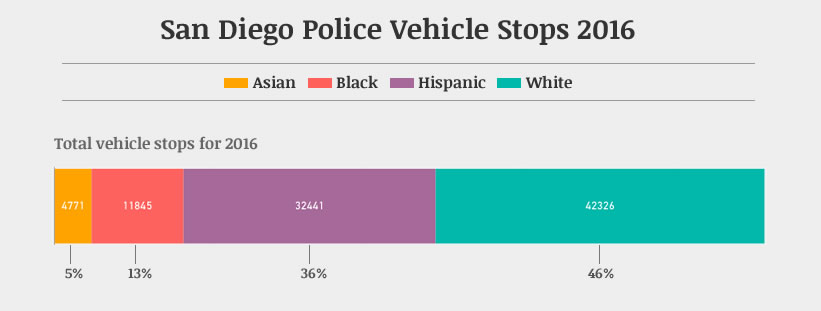
Is more domestic violence happening in Los Angeles while people are being quarantined? You might be surprised at what the data shows.

Many experts around the world expect there to be more cases of domestic violence during the quarantine lockdown, as more people are forced to spend more time together since people are not going to work or out in public due to the lockdown. Are the numbers saying that is the case?

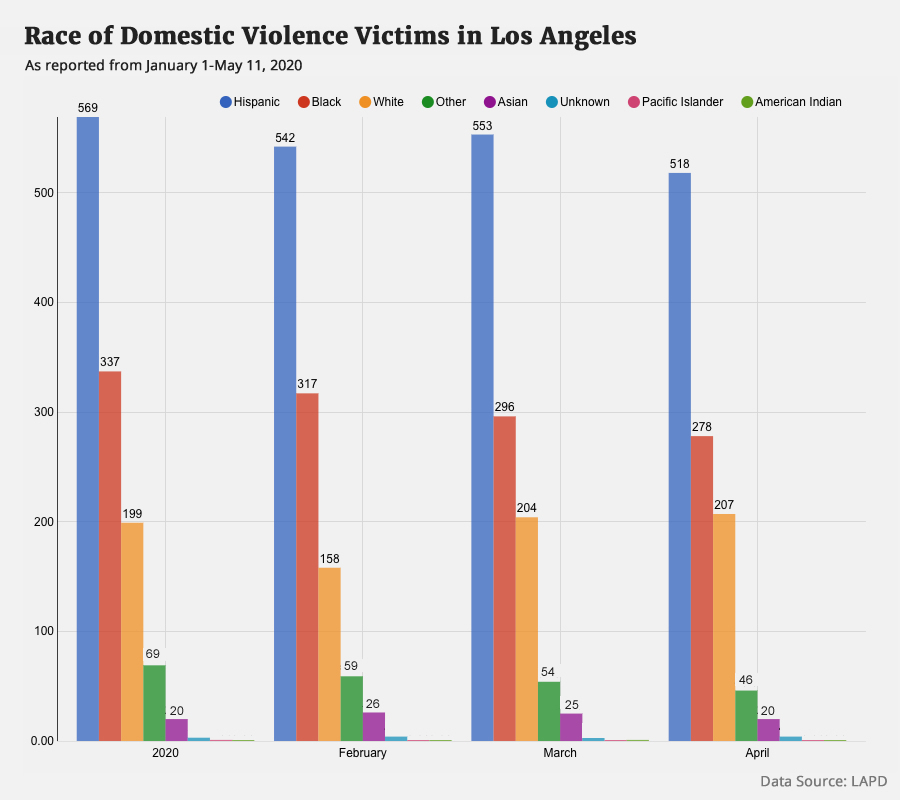
The map below shows all the reported cases of domestic violence and the locations of each incident. The different colors represent the races of the victims of domestic violence. This map is also interactive so you can hover over any dot to find details of the abuse, including:

  • Race of the victim
  • Sex of the victim
  • Age of the victim
  • Date of incident
  • Time of incident
  • Name of area
  • Weapon used
That’s nearly 5,000 instances of domestic violence that the police have responded to so far this year in L.A. How how does that compare to what is “normal”? The chart below shows statistics for the first four months of the year.
Here’s one more chart, with victims of domestic violence broken down by race.

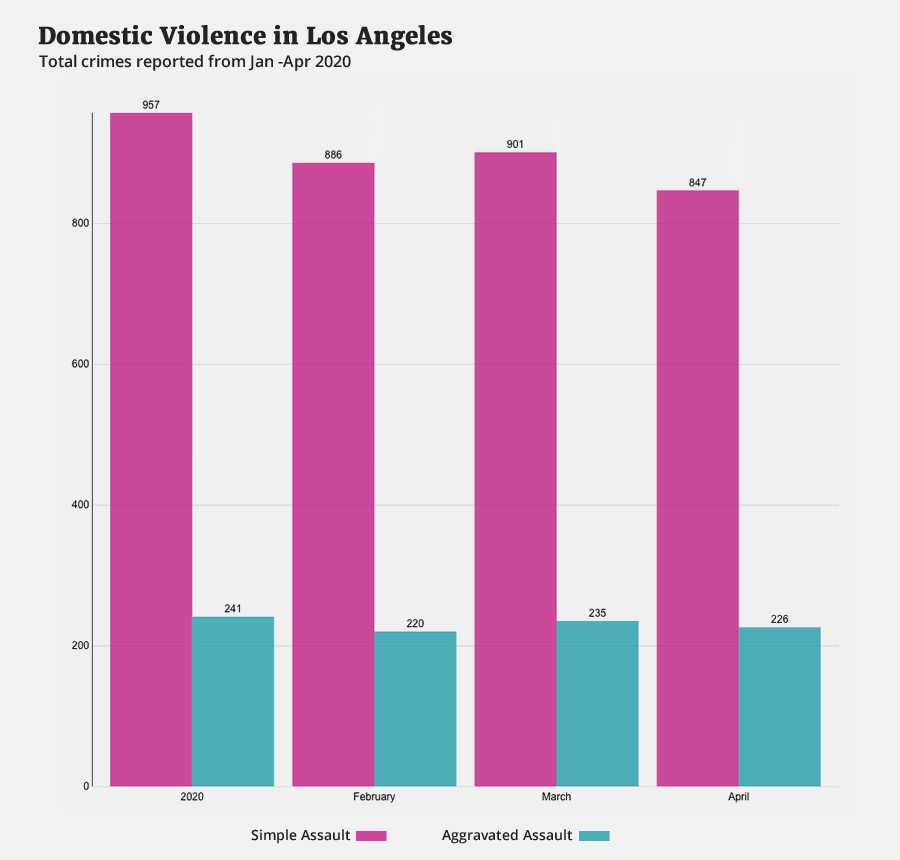
It is surprising to see that the numbers of reported cases have actually gone down overall. Why is this the case?

Can this be explained by the fact that victims are not able to escape their abusers during the time when they are locked down, so reporting is down? Yes. 

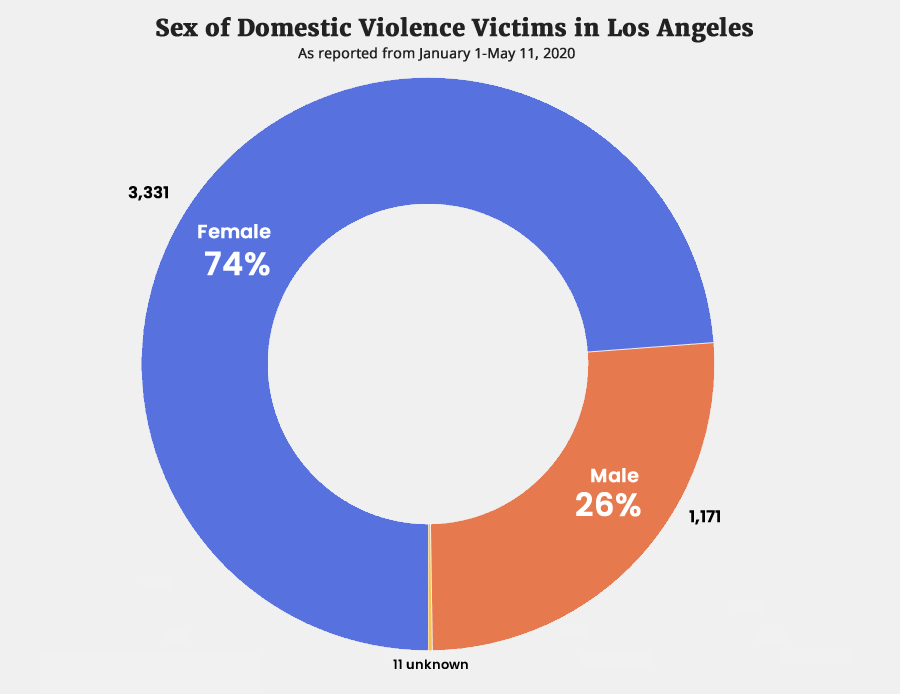
FYI, it’s not just females that are the victims of domestic violence. More than 1/4 of all victims are males.

Weapons Used

In over 87% of all cases involving domestic violence, the reported weapon used is hands, fist , feet or bodily force. But 13% of the time other weapons are used.

Here we can also see the weapon used as reported to LAPD. Take a look at some of the weapons used. While hands, fist, feet or bodily force is obviously the most used, take a look at some of these others.

Weapon Used Count
STRONG-ARM (HANDS, FIST, FEET OR BODILY FORCE) 3947
UNKNOWN WEAPON/OTHER WEAPON 211
BOTTLE 27
KNIFE WITH BLADE 6INCHES OR LESS 27
OTHER KNIFE 25
VEHICLE 25
BLUNT INSTRUMENT 24
HAND GUN 21
STICK 21
VERBAL THREAT 19
KITCHEN KNIFE 13
CLUB/BAT 12
FOLDING KNIFE 11
MACE/PEPPER SPRAY 11
ROCK/THROWN OBJECT 11
BELT FLAILING INSTRUMENT/CHAIN 10
KNIFE WITH BLADE OVER 6 INCHES IN LENGTH 10
PIPE/METAL PIPE 10
 UNKNOWN 9
SEMI-AUTOMATIC PISTOL 9
SCISSORS 8
HAMMER 7
FIXED OBJECT 6
SCREWDRIVER 4
AIR PISTOL/REVOLVER/RIFLE/BB GUN 3
GLASS 3
MACHETE 3
REVOLVER 3
SCALDING LIQUID 3
STUN GUN 3
CONCRETE BLOCK/BRICK 2
LIQUOR/DRUGS 2
OTHER CUTTING INSTRUMENT 2
RAZOR BLADE 2
SHOTGUN 2
UNKNOWN FIREARM 2
BRASS KNUCKLES 1
HECKLER & KOCH 93 SEMIAUTOMATIC ASSAULT RIFLE 1
RAZOR 1
RIFLE 1
SWITCH BLADE 1

If you or someone you know is experiencing domestic violence, contact the National Domestic Violence Hotline by calling 1-800-799-SAFE (7233), visiting www.thehotline.org or texting LOVEIS to 22522.

Los Angeles Crime Statistics in 2020 by Race

The map above shows crimes committed in Los Angeles from January 2020 to mid May 2020. The colors represent the race of the crime victims, including:

  • A – Other Asian
  • B – Black
  • C – Chinese
  • D – Cambodian
  • F – Filipino
  • G – Guamanian
  • H – Hispanic/Latin/Mexican
  • I – American Indian/Alaskan Native
  • J – Japanese
  • K – Korean
  • L – Laotian
  • O – Other
  • P – Pacific Islander
  • S – Samoan
  • U – Hawaiian
  • V – Vietnamese
  • W – White
  • X – Unknown
  • Z – Asian Indian

The data shows that hispanics represent the largest number of crime victims in the city of Los Angeles, with a total of 21,934. Whites are second at 14,520 and blacks are third at 9,643. The chart above does not include any where the race was unknown.

First Names of NYC Taxi & Limo Drivers

featured

NYC drivers names

Ever wondered what the most common names are for NYC taxi or limo drivers? The data comes from the city’s Taxi and Limousine commission (TLC), found on the NYC Open Data portal. All names data is for TLC Licensed FHV drivers that are currently active and in good standing.

As you can see, the name Mohammad (and variations of the name) is by far the most popular. If you combine the 4 most common variations of the name (Mohammad, Mohammed, Muhammad and Mohamed), the combined total is 10,255. By leaps and bounds, this is by far the most popular name among FHV drivers in New York.

First Name Count
MOHAMMAD 3612
MOHAMMED 2901
JOSE 2845
MUHAMMAD 1975
MOHAMED 1767
LUIS 1535
JUAN 1483
AHMED 975
CARLOS 967
JEAN 947
MICHAEL 826
MAMADOU 816
ABDUL 809
SYED 809
RAFAEL 720
DAVID 708
JOSEPH 699
JOHN 663
RAMON 648
ALI 643
VICTOR 625
MIGUEL 597
MANUEL 564
JORGE 547
DANIEL 527
FRANCISCO 522
PEDRO 522
JULIO 477
ANGEL 457
ANTHONY 453
ROBERT 453
RICHARD 428
GEORGE 401
FELIX 395
WILLIAM 395
JAMES 354
IBRAHIM 351
HECTOR 336
IBRAHIMA 319
CHRISTOPHER 306
OMAR 305
SAMUEL 305
ALEXANDER 302
JONATHAN 302
EDWIN 300
EMMANUEL 300
NELSON 297
HENRY 286
GURPREET 276
HASSAN 270
CESAR 261
AMADOU 256
ROBERTO 254
KEVIN 253
PETER 250
EDWARD 249
JESUS 249
ERIC 247
FRANK 244
PAUL 244
WILSON 242
ANTONIO 238
JOEL 238
STEVEN 235
CHARLES 233
MARIO 231
KHALID 230
ABDOULAYE 229
RICARDO 222
TENZIN 219
IMRAN 217
ALPHA 211
RONALD 207
MARIA 205
MAHMOUD 202
OSCAR 202
ABU 201
FERNANDO 197
MARK 196
THOMAS 195
AHMAD 192
FRANKLIN 191
MOUSSA 191
PIERRE 189
KAZI 187
KHALED 185
PABLO 184
FNU 182
SHAHID 182
ALEX 181
EDUARDO 180
PATRICK 179
GABRIEL 177
GIORGI 177
VLADIMIR 176
ABDULLAH 173
ALBERTO 170
THIERNO 169

Who Gets Pulled Over by Police in San Diego, CA?

Who gets pulled over by police in San Diego County? Do police have traffic ticket quotas? Are specific races targeted and pulled over more frequently than others? We looked at the data on the San Diego open data portal to find out.

Do Police have traffic ticket quotas in San Diego?

Traffic ticket quotas are illegal according to California state law, but looking at the monthly totals, you may wonder why the numbers are so high in the beginning of the year. In the first three months of the year, police vehicle stops were higher than any other month. Especially in the month of February. The shortest month of the year had the most vehicle stops on record for white, hispanics, and black people at a total of 8,865. The monthly average for the year was 7,615 and February was more than 16% higher. Break it down per day and the numbers are even higher. For the four groups we looked at, there are an average of 250 police vehicle stops. In the month of February, the daily average was 306 stops a day.  Do police in San Diego have quotas to hit? If there are police ticket quotas, it wouldn’t be the first time this was alleged in California. It wouldn’t even be the first time ticket quotas were an issue in San Diego.

Are any races targeted in police vehicle stops?

If you looked at total numbers, you would see whites are pulled over the most with 42,326 vehicle stops in 2016. Hispanics followed next with over 32,441 stops, blacks at 11,845 and asians with 4,721.  Combined that’s a total of 91,383 police vehicle stops among the 4 groups. However, it wouldn’t be fair to just look at total numbers without taking into account the  percentage of population.

San Diego police vehicle stops

Although blacks make up under 6% of the population, they accounted for 13% of all traffic stops in San Diego this past year.  Asian people on the other hand made up 5% of all traffic stops even though they represent 12% of the population here in the county. Whites and hispanics were pulled over almost exactly the same as their population percentage.

Who gets arrested most after being pulled over?

When you look at arrests that occurred after traffic stops, black people made up 24% of all arrests made during traffic stops, more than 4x the percentage of the black population in the county. Hispanics accounted for 42%, higher than the 36% they represent in the population. Whites made up 34% of arrests, with asians at less than 2%.

Vehicle stops where contraband was found

Contraband refers to illegal goods such as drugs, weapons, etc. There were 272 police stops in 2016 where contraband was found among these 4 groups. Hispanics made up 40% of the total, slightly higher than the 35.5% of the population they represent. Blacks accounted for 25% of incidents where contraband was found. Whites accounted for 34% of stops involving contraband and asians less than 1%.